9 互動式資料呈現
在R中有多種互動式資料呈現方式,除了傳統的GGobi、iPlots、identify等套件外,結合網頁呈現的互動畫呈現方式有更多的彈性,以下介紹幾種好用的互動式套件:
- ggvis
- googleVis
- Plot.ly
使用者可依需求選擇使用。
最後再介紹Shiny,一個RStudio推出供R語言使用的網頁應用框架,使用者可以將做好的互動式圖表用Shiny部署網頁,並將分析結果以網頁的方式分享給別人。
9.1 ggvis
ggvis(Chang and Wickham 2019) 是RStudio開發的互動式繪圖套件,繪圖語法與ggplot2(Wickham, Chang, et al. 2020)套件類似,基本概念是使用R做資料處理與分析,然後利用網頁的方式做視覺化呈現。如果使用RStudio IDE,透過ggvis套件畫的圖會呈現在右下角的Viewer視窗中。
使用ggvis套件時,必須先安裝與載入
增加input_slider函數,讓使用者可以調整圖形畫圖方式(因書本輸出格式,不支援動態畫圖,請將程式碼複製貼上到RStudio中就能看到互動式畫圖的樣子)
p<-ggvis(mtcars,~wt)
layer_histograms(p,width =  input_slider(0, 2, step = 0.10, label = "width"),
                   center = input_slider(0, 2, step = 0.05, label = "center"))
## Warning: `group_by_()` is deprecated as of dplyr 0.7.0.
## Please use `group_by()` instead.
## See vignette('programming') for more help
## This warning is displayed once every 8 hours.
## Call `lifecycle::last_warnings()` to see where this warning was generated.## Warning: `mutate_()` is deprecated as of dplyr 0.7.0.
## Please use `mutate()` instead.
## See vignette('programming') for more help
## This warning is displayed once every 8 hours.
## Call `lifecycle::last_warnings()` to see where this warning was generated.## Warning: Can't output dynamic/interactive ggvis plots in a knitr document.
## Generating a static (non-dynamic, non-interactive) version of the plot.除了input_slider()外,ggvis還提供以下互動式輸入介面:
- input_checkbox()
- input_checkboxgroup()
- input_numeric()
- input_radiobuttons()
- input_select()
- input_text()
其他詳細使用說明請參考官網
##googleVis googleVis(Gesmann and de Castillo 2020) package是基於Google Chart API開發的R套件,使用前需要先安裝與載入。
如果想要一次看完所有作圖範例,可用以下指令(執行完畢需要一點時間)
googleVis套件提供多種繪圖方式,包括:
- 一維資料做圖
- gvisHistogram
- 類別-數值資料做圖
- gvisPieChart
- gvisGauge
- gvisBarChart
- gvisColumnChart
- gvisCandlestickChart
- 數值-數值資料做圖
- gvisLineChart
- gvisAreaChart
- gvisSteppedAreaChart
- gvisScatterChart
- gvisAnnotationChart
- 數值-數值-數值資料做圖
- gvisBubbleChart
- 地圖相關
- gvisIntensityMap
- gvisGeoChart
- gvisMap
- 其他圖形
- gvisOrgChart
- gvisTreeMap
- gvisSankey
- gvisComboChart
- gvisCalendar
- gvisTimeline
詳細使用說明請參考googleVis套件說明
df=data.frame(country=c("US", "GB", "BR"),
              val1=c(10,13,14),
              val2=c(23,12,32))
Line <- gvisLineChart(df)
plot(Line)require(datasets)
states <- data.frame(state.name, state.x77)
GeoStates <- gvisGeoChart(states, "state.name", "Illiteracy",
options=list(region="US",
displayMode="regions",
resolution="provinces",
width=600, height=400))
plot(GeoStates)AndrewMap <- gvisMap(Andrew, "LatLong" , "Tip",
options=list(showTip=TRUE,
showLine=TRUE,
enableScrollWheel=TRUE,
mapType='terrain',
useMapTypeControl=TRUE))
plot(AndrewMap)其他Google Chart可以做的圖形種類,可以參考Chart Gallery
9.2 Plot.ly
Plotly是一個線上分析與視覺化的工具,如需線上作圖,可至https://plot.ly/create/ 建立帳號並開始作圖。Plotly也提供套件R使用,使用者可以透過安裝plotly(Sievert et al. 2020) package在R中畫基於Plotly.js (d3.js + stack.gl)的圖表和地圖。除了R的套件外,還有Python, MATLAB, Perl, Julia, Arduino等套件可供使用。
使用plotly套件時,必須先安裝與載入
d <- diamonds[sample(nrow(diamonds), 1000), ]
plot_ly(d, x = ~carat, y = ~price, color = ~carat,
        size = ~carat, text = ~paste("Clarity: ", clarity))
## Warning: `arrange_()` is deprecated as of dplyr 0.7.0.
## Please use `arrange()` instead.
## See vignette('programming') for more help
## This warning is displayed once every 8 hours.
## Call `lifecycle::last_warnings()` to see where this warning was generated.## Warning: `line.width` does not currently support multiple values.p <- ggplot(data = d, aes(x = carat, y = price)) +
geom_point(aes(text = paste("Clarity:", clarity))) +
geom_smooth(aes(colour = cut, fill = cut)) + facet_wrap(~ cut)
ggplotly(p)Plotly提供免費的圖形分享空間,方便使用者將做好的圖上傳到網路上,若想使用Plotly提供圖形分享空間,必須要先申請Plotly帳號,透過此網頁取得API keys,並使用下列程式碼設定帳號與API keys
設定完基本資料後,使用plotly_POST函式將plotly物件p上傳到指定路徑(filename)的網路空間中。
參考資料
9.3 Shiny簡介
Shiny是RStudio推出供R語言使用的網頁應用框架(Web application framework),透過Shiny,使用者可以輕鬆地將資料分析結果轉換成互動式的網頁應用,不用另外學習其他網頁程式語言(如HTML, CSS, JavaScript等),若要使用Shiny,RStudio IDE提供完整測試預覽功能,建議一起使用。使用前必須先安裝並載入shiny (Chang et al. 2020) package
shiny package內提供11個網頁部署範例,使用者可以直接用下列程式碼觀看相關範例的呈現效果與原始碼
runExample("01_hello") # a histogram
runExample("02_text") # tables and data frames
runExample("03_reactivity") # a reactive expression
runExample("04_mpg") # global variables
runExample("05_sliders") # slider bars
runExample("06_tabsets") # tabbed panels
runExample("07_widgets") # help text and submit buttons
runExample("08_html") # Shiny app built from HTML
runExample("09_upload") # file upload wizard
runExample("10_download") # file download wizard
runExample("11_timer") # an automated timer
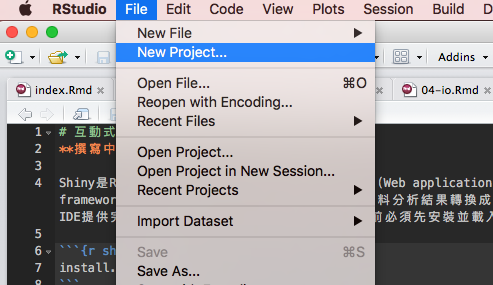
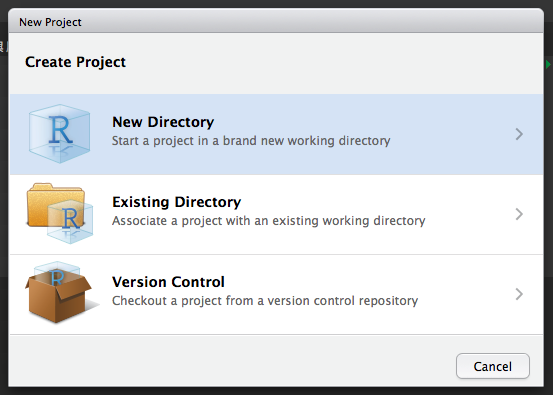
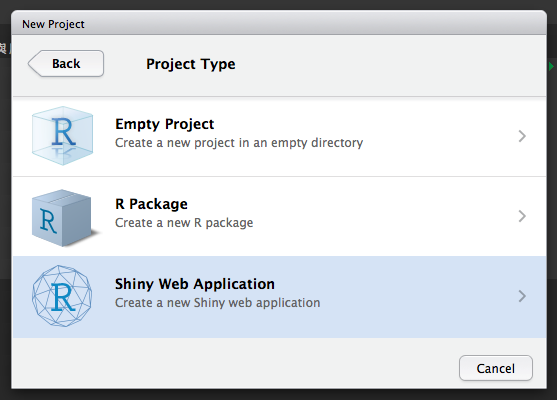
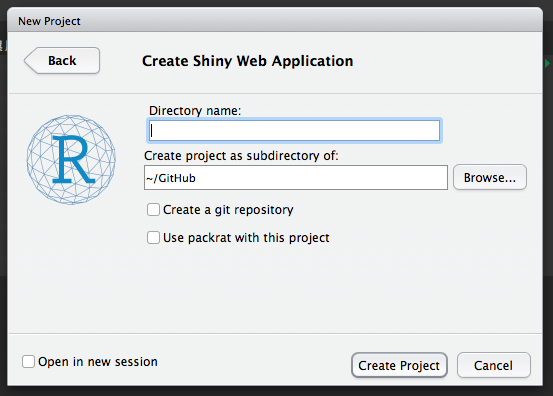
在RStudio內,可直接透過新增專案 New Project新增Shiny應用程式
Shiny應用程式包括兩個元件:
- ui.R : 使用者介面(前端)程式碼 user-interface script
- server.R : 伺服器端(後端)程式碼 server script
使用者介面程式碼ui.R控制Shiny應用程式的外觀,伺服器端程式碼server.R控制Shiny應用程式的功能。
ui.R範例
library(shiny)

shinyUI(fluidPage(

  # 網頁標題
  titlePanel("Hello Shiny!"),

  # Sidebar + slider
  sidebarLayout(
    sidebarPanel(
      sliderInput("bins",
                  "Number of bins:",
                  min = 1,
                  max = 50,
                  value = 30)
    ),

    # 圖形呈現
    mainPanel(
      plotOutput("distPlot")
    )
  )
))
server.R範例
library(shiny)

shinyServer(function(input, output) {


  # 將直方圖Histogram存入distPlot變數,在UI端用plotOutput呈現
  output$distPlot <- renderPlot({
    x  <- faithful[, 2]  # Old Faithful Geyser data
    # input$bins是用UI端的Sidebar + slider調整
    bins <- seq(min(x), max(x), length.out = input$bins + 1)
    hist(x, breaks = bins, col = 'darkgray', border = 'white')
  })
})若想使用介紹過的Plotly與Shiny結合,可參考此教學網頁。
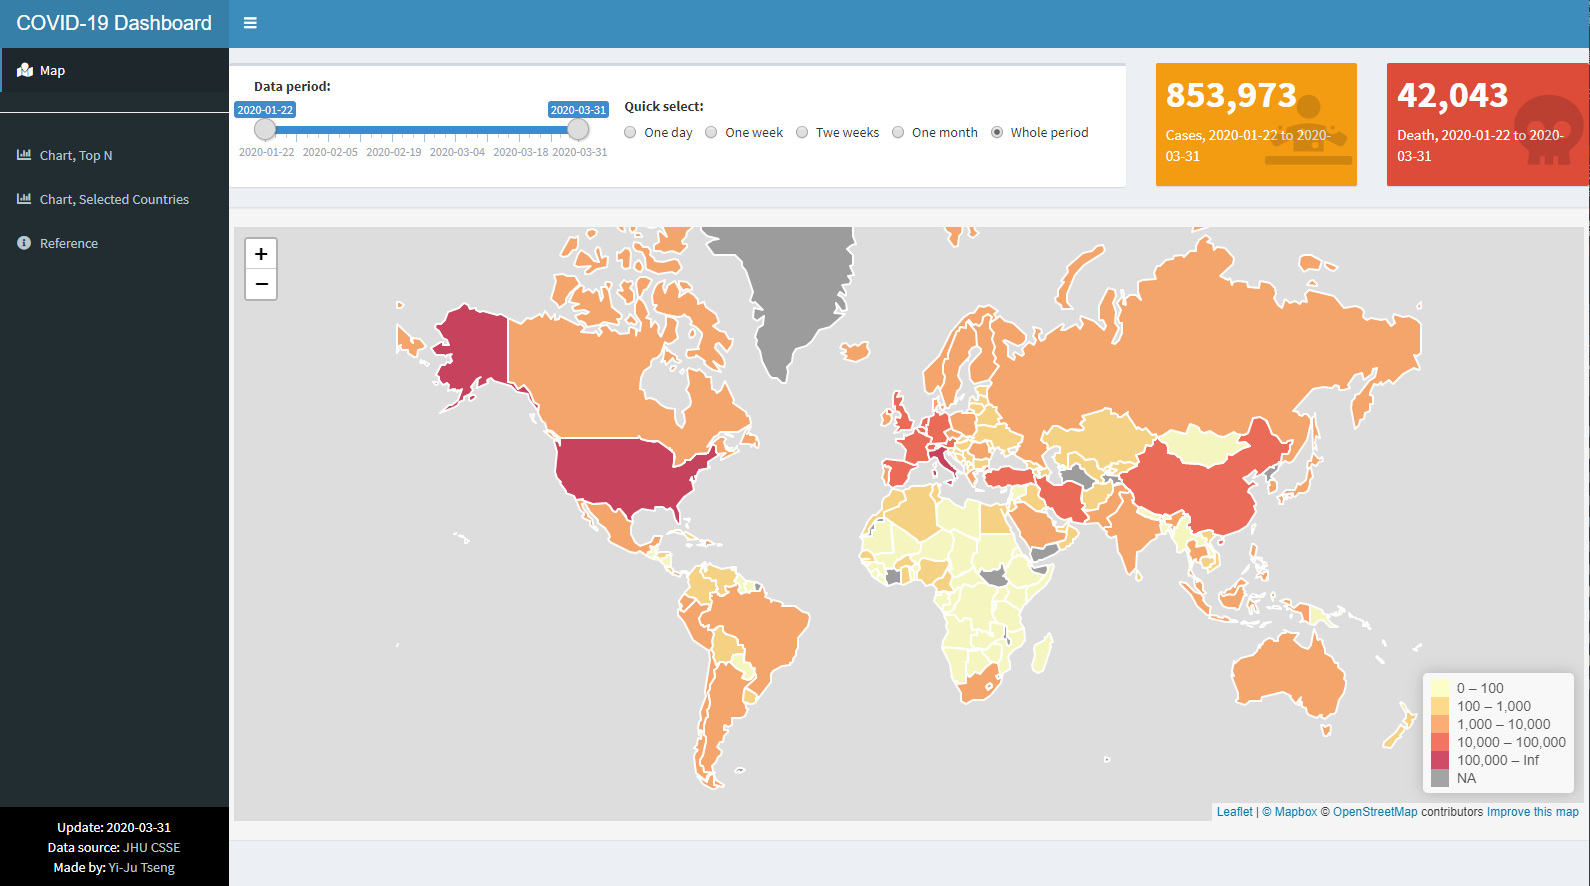
更深入的Shiny教學,可參考使用R Shiny設計資料科學應用程式,為專為Shiny App開發撰寫的電子書,並深入解說如何使用Shiny建立新冠肺炎COVID-19的案例數地圖與儀表板。
參考資料
References
Chang, Winston, Joe Cheng, JJ Allaire, Yihui Xie, and Jonathan McPherson. 2020. Shiny: Web Application Framework for R. https://CRAN.R-project.org/package=shiny.
Chang, Winston, and Hadley Wickham. 2019. Ggvis: Interactive Grammar of Graphics. https://CRAN.R-project.org/package=ggvis.
Gesmann, Markus, and Diego de Castillo. 2020. GoogleVis: R Interface to Google Charts. https://CRAN.R-project.org/package=googleVis.
Sievert, Carson, Chris Parmer, Toby Hocking, Scott Chamberlain, Karthik Ram, Marianne Corvellec, and Pedro Despouy. 2020. Plotly: Create Interactive Web Graphics via ’Plotly.js’. https://CRAN.R-project.org/package=plotly.
Wickham, Hadley, Winston Chang, Lionel Henry, Thomas Lin Pedersen, Kohske Takahashi, Claus Wilke, Kara Woo, Hiroaki Yutani, and Dewey Dunnington. 2020. Ggplot2: Create Elegant Data Visualisations Using the Grammar of Graphics. https://CRAN.R-project.org/package=ggplot2.